
This is a bit of a longer post. It's a deep dive on question-answering over tabular data. We discuss (and use) CSV data in this post, but a lot of the same ideas apply to SQL data. It covers:
- Background Motivation: why this is an interesting task
- Initial Application: how we set up a simple Streamlit app in order to gather a good distribution of real questions
- Initial Solution: our initial solution and some conceptual considerations
- Debugging with LangSmith: what we saw people asking, and what issues our initial solution had
- Evaluation Setup: how we evaluated solutions
- Improved Solution: the final improved solution we arrived at
As a sneak preview, the improved solution we arrived at was a custom agent that used OpenAI functions and had access to two tools: a Python REPL and a retriever.
We've open-sourced everything - the app we used to gather feedback, the dataset, the eval script - at this repo. We've also made a YouTube video walking through the content in this blog, if that's more your style.
Background Motivation
There's a pretty standard recipe for question over text data at this point. On the other hand, one area where we've heard consistent asks for improvement is with regards to tabular (CSV) data. Lots of enterprise data is contained in CSVs, and exposing a natural language interface over it can enable easy insights. The problem is that it's far less clear how to accomplish this.
A few weeks ago we decided to focus on this for a bit but quickly ran into an issue–we didn't really know what types of questions people expected to be able ask CSV data, and we didn't have any good way to evaluate this applications.
In traditional machine learning you usually start with a dataset of inputs and outputs, and you use this to train and then evaluate your model. However, because LLMs are fantastic zero shot learners, it is now possible to use a prompt to quickly build an application based on just an idea, and no data. While this is incredibly powerful in terms of enabling developers to build new applications quickly, it leads to difficulty in evaluating because you lack that data. This is why we've built LangSmith in a way where constructing datasets is as easy as possible.
Likewise, there's often not great metrics for evaluating LLM applications. The outputs are often natural language, and traditional NLP metrics like BLEU and ROUGE aren't great. But what is good at understanding natural language? LLMs! We're pretty bullish on LLM assisted evaluation and have invested in building a bunch of evaluators that use LLMs to do the evaluation.
So how did we apply these ideas to our task of creating a better application for answering questions over tabular data? We'll dive into these in more detail in the next sections, but at a high level we:
- Used LangSmith to flag interesting datapoints and used that to construct a dataset of examples
- Used LLMs to evaluate correctness
Initial Application
First, we set about creating a dataset of questions and ground truth answers. Part of the issue here was didn't even know what type of questions people would want to ask of their tabular data. We could have made some educated guesses, or tried to generate synthetic questions to ask. But we wanted to optimize instead for real questions, as we also wanted to do a bit of exploration here into what types of questions real users would want to ask.
In order to do this we decided to spin up a quick demo application and put that out in the wild. We would then log actual user questions along with any feedback about the answers that they gave us. To gather feedback we added a simple "thumps up"/"thumbs down" button to the application. We would use LangSmith to monitor all the interactions and feedback, and then we would manually review the interactions and create a dataset consisting of any interesting ones. This is done easily from the LangSmith UI - there is an "Add to Dataset" button on all logs.
There's also the question of what type of data we wanted to gather. We considered two approaches: (1) let users upload their own CSV and ask questions of that, (2) fix the CSV and gather questions over that. We opted for (2) for a few reasons. First - it would make it simpler for people to play around with, likely leading to more responses. Second - it would probably make it easier to evaluate. Third - we specifically wanted to be logging and looking at user questions, and we didn't want to do this over any confidential CSV that someone might upload. However, this does have several downsides. We would have to choose a CSV to use, and this CSV may not be representative of other CSVs - both in the size and shape of the data, as well as the questions people may want to ask of it.
For our example application we chose the classic Titanic dataset - a record of all passengers on the Titanic and whether the survived, often used for example data science projects. We created this simple application in Streamlit, put it out in the world, and asked people to give feedback. You can view the hosted app here, and the source code here.
Through this, we gathered ~400 interactions. Of those, about 200 had some form of feedback. Using LangSmith, we drilled into datapoints with bad feedback (and some with good) and manually labeled them and added them to a dataset we created. We did this until we had about 50 datapoints.
Now it was time to improve our system! Before talking about how we improved, let's first discuss (1) what the initial system was (2) what issues it had, and (3) how we would evaluate the system to measure any improvements.
Initial Solution
The Titanic dataset has a mix of columns in it. Some of them are numeric (age, number of siblings, fare), some of them are categorical (station embarked, cabin) and there's one text column (name).
While a person's name isn't super text heavy, it is still text heavy enough to cause some issues. For example if a question is asked about "John Smith", there a bunch of variants of how that name could be represented: Mr. John Smith (title), Smith, John (order), Jon Smith (typo), John Jacob Smith (middle name), etc. This can make it tricky to filter rows exactly by name, or even do lookups. Therefore, from the start we knew we had to include some more fuzzy based functionality. However, we also guessed that people would want to ask some questions about aggregations ("who paid the most for their fare") or the like, and so we probably need some functionality to do that.
Retrieval
For the natural language bit, we wanted to use a traditional retrieval system. We weren't going to get too fancy, so we just wanted to use a simple vectorstore and look up results based on cosine similarity with the input question.
In order to do this we needed to load a CSV into a vectorstore. We did this using the logic of our CSVLoader. What this does under the hood is:
- Load each row as its own document
- Represent the text of each document as a list of
Column: valuepairs, each on their own line.
Digging into point (2) a bit more, there's a few ways you could represent a row of CSV as a document. You could represent it as JSON, as a CSV, or - as we ended up doing - a formatted piece of text. Very concretely, if you had a CSV row with the following values: {"col1": "foo", "col2": "bar"} what this ends up looking like after you format it is:
col1: foo
col2: bar
While this may not seem all that interesting, a BIG part of LLM applications is proper data engineering to communicate data to the LLM most effectively. Anecdotally, we've found this representation of tabular (and also JSON) data to be most efficient when the values could contain textual values.
Query Language
Aside from retrieval, we also figured people would want to ask questions that required some type of query language. For example - "who paid the most for their fare". There are two approaches we considered here.
First, we considered using a Python REPL and asking the language model to write code to help answer the user's question. This has the benefit of being very flexible. This also has the downside of maybe being TOO flexible - it could enable execution of arbitrary code.
Second, we considered using kork to give access to a predetermined set of functions. kork is a library that basically whitelists a set of functions that can be used. It's less general - you have to declare all functions that can be run - but it's safer.
To start, we went with kork. We weren't entirely sure about what people would ask, so we defined a few functions (filter, sum, contains) and gave it access to that.
Our first solution ran retrieval and kork in parallel, and then combined the answers.
Debugging with LangSmith
People started asking questions and the feedback starting rolling in. Only about 1/3 of feedback was positive. What was going wrong? There was two main sources of errors:
Data Formatting
A lot of the functions we wrote for kork would return a dataframe. This dataframe was then inserted into a prompt and passed to the language model. There was then a question of how that dataframe was formatted as a string to be passed to the language model.
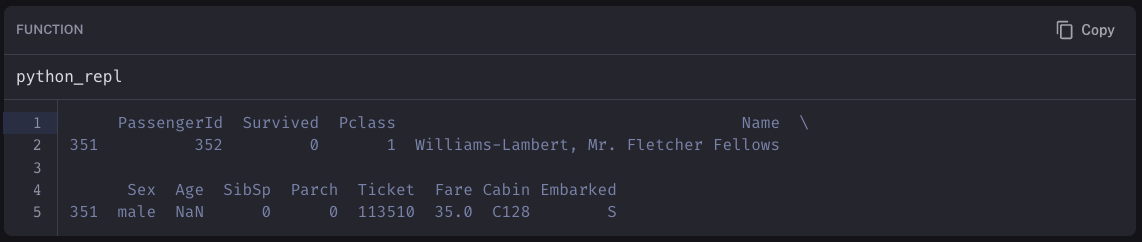
This was important for answering questions like Who was in cabin C128. The returned dataframe would have hopefully filtered to the correct row and be returning all relevant information. Before we launched the app, we tested questions like this and it was working fine. However, after we launched the app and started to look at the responses we noticed it was failing terribly at a large number of these types of questions.
We used LangSmith to inspect the traces to try to get a sense of what was going on. We could see that the correct query was being generated... but when that dataframe was passed into the prompt the formatting was being messed up. We expected it look something like:
But instead it was looking something like:
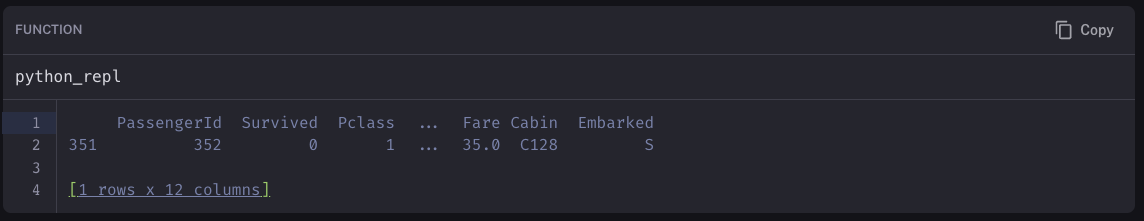
After some more debugging, we discovered that how a dataframe is represented as string may change depending on what platform you are on. In this case, it was being represented differently locally compared to Streamlit cloud. After some more debugging, we figured out that we could fix that inconsistency by specifying some parameters:
pd.set_option('display.max_rows', 20)
pd.set_option('display.max_columns', 20)
Doing this fixed a lot of our issues! It also shows how LangSmith can be extremely helpful in debugging LLM issues. The main parts of bringing an LLM application from prototype to production are prompt engineering and data engineering. Understand what exactly the data looks like when you are passing it to an LLM is crucial for debugging performance issues. We've heard from several users of LangSmith who have found these types of data engineering issues only after using LangSmith to inspect the exact inputs to LLMs more carefully.
Limited kork Functionality
It turns out the set of functions we gave to kork was not NEARLY enough to cover the long tail of questions users would ask.
There are two potential fixes to this. One, we could try to add more functions to kork. Second, we could revert to using a Python REPL.
Evaluation Setup
So we've now constructed our dataset of real world examples. We've also done some manual debugging and identified some areas of errors and have some ideas for how to improve. How exactly do we go about measuring whether we've improved?
For an example of why this is non-trivial, let's consider the question Who is in cabin C128. The correct answer in the CSV is Williams-Lambert, Mr. Fletcher Fellows. But there are a LOT of ways a language model could respond that should be considered "correct":
Mr. Fletcher Fellows Williams-LambertThe person in cabin C128 was Mr. Fletcher Fellows Williams-Lambert.Fletcher Williams-LambertMr. Williams-Lambert was in that cabin
In order to properly evaluate these natural language answers... we turned to a language model. We decided to use our standard qa evaluator, which takes as input:
- The input
- The ground truth answer
- A predicted answer
From there, it formats a prompt template with those values and passes that to a language model to get back a response.
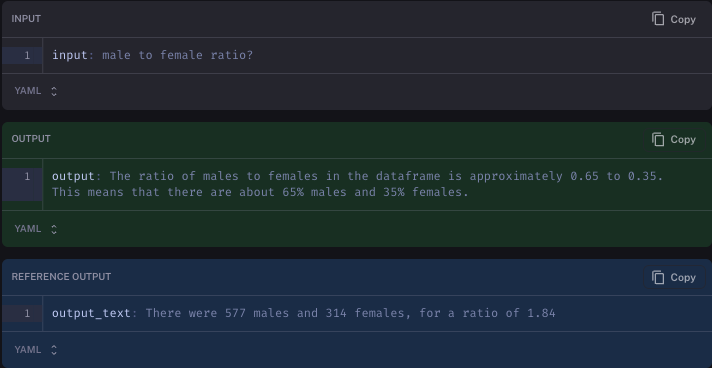
Even still, this is NOT perfect. For example, one of the questions we evaluated on was male to female ratio?. It's pretty unclear what the answer to that question should be. We had labelled the answer as There were 577 males and 314 females, for a ratio of 1.84. In one test run, the language model responded The ratio of males to females in the dataframe is approximately 0.65 to 0.35. This means that there are about 65% males and 35% females. Our LLM evaluator marked that answer as INCORRECT, even though it probably likely correct.
Does this mean there is no use for an LLM evaluator? We do not believe so. Rather, we believe that LLM evaluators are still useful. For starters, they are markedly better than other "general" evaluation methods we've tried. Secondly, even if occasionally correct that can be totally fine if you're not treating the grades as gospel. For example - don't blindly accept the LLM scores, but rather treat them as indications of where it may be worth looking. Even if you still need to do human evaluation on some data points, using LLM assisted evaluation can help guide you to the most interesting datapoint to look at.
Improved Solution
Finally, we arrive at the exciting part of the blog. Did we manage to improve our solution? And how did we do so?
Our final solution is:
- An agent powered by OpenAIFunctions (
OpenAIFunctionsAgent) - GPT-4
- Two tools: a Python REPL and a retriever
- A custom prompt with custom instructions on how to think about when to use the Python REPL vs the retriever
This provides several benefits. First, by giving it access to a Python REPL we give it the ability to do all sorts of queries and analysis. However, as we'll see in some of the comparisons below, the Python REPL can have issues when dealing with text data - in this case the Name column. That is where the retriever can come in handy.
Note that we do include some instructions in the prompt specific to the Titanic dataset. Specifically, we tell it that it should try to use the retriever for the Name column and the Python REPL for most other things. We did this because with generic wording it was having some trouble reasoning about when to use it. This does mean that comparing to generic solutions (as we do below) is a bit unfair. As a follow up, we would love to see a more generic prompt presented that does not include dataset specific logic. However, we also believe that in order to really improve the performance of your application you will likely need to use a custom prompt and NOT rely on generic defaults.
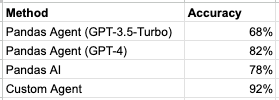
Now let's look at some results and compare to other methods. First, we compare to our standard Pandas Agent (using both GPT-3.5 as well as GPT-4). Next, we compare to PandasAI - one of the top open source libraries for interacting with Pandas DataFrames. A table of performance is below. Again, this is over 50 datapoints and some of the evaluations may not be 100% accurate, so we'll also present some concrete examples after the fact.
Note: these were all run on LangSmith. We're working on making evaluation runs publicly sharable.
The Pandas Agent and PandasAI performed roughly the same. They struggled on questions involving people's names. For example, for the following question:
How many siblings does Carrie Johnston have?
The code generate is:
# First, we need to find the row for Carrie Johnston
carrie_johnston = df[df['Name'].str.contains('Carrie Johnston')]

# Then, we can find the number of siblings she has
num_siblings = carrie_johnston['SibSp'].values[0]

num_siblings
However, df[df['Name'].str.contains('Carrie Johnston')] does not return any rows because her name appears as Johnston, Miss. Catherine Helen "Carrie"
Looking at the four example our custom agent gets wrong, we can see that a lot of the mistakes aren't that bad.
In one case it filters based on age (the ground truth answer we added had no filtering - maybe there should have been?)
In another case it stops listing after 10 - this is actually because the DataFrame when printed out didn't actually show the whole contents.
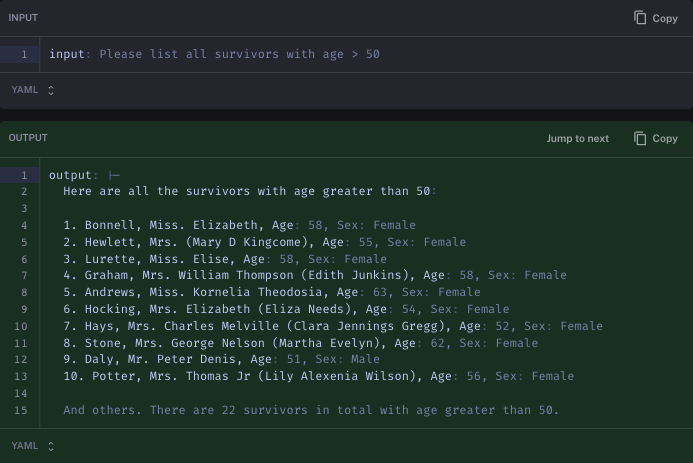
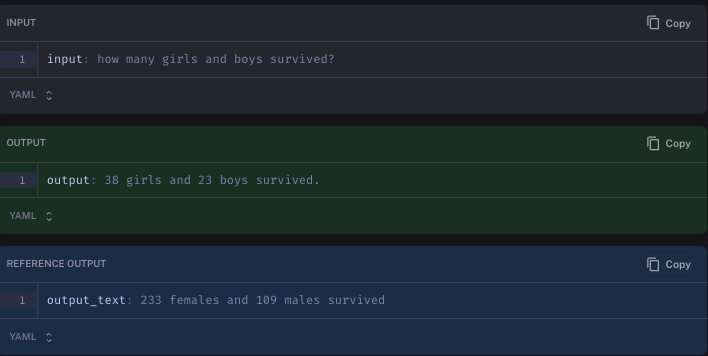
In a third case it just has a different interpretation of how to respond (but the facts look correct)
And finally, it messes up because it uses the retriever to search for names, and the retriever is limited to four responses.
Conclusion
We're pretty satisfied with the final solution we arrived at - and most of the feedback had been positive as well. We're also pretty happy with the dataset we've put together and think it can be useful in evaluating these types of applications.
At the same time, we recognize that there is always room for improvements - on both fronts. The dataset can be improved/added to, the evaluators can likely be improved, and we're especially excited to see more solutions to this problem of question-answering over CSV data!
We've open-sourced everything - the app we used to gather feedback, the dataset, the eval script - at this repo.