Tag and Metadata Grouping
LangSmith has long supported monitoring charts to showcase important performance and feedback metrics overtime for your LLM applications (see the Monitoring section in any project details page). However, until now, it wasn't possible to compare metrics of logged traces containing different tags or metadata. In LLM applications, there can often be many knobs at your disposal (model params, prompt, chunking strategy, look-back window), each having a potentially huge impact on your application.
With tag and metadata grouping, users of LangSmith can now mark different versions of their applications with different identifiers and view how they are performing side-by-side using the new monitoring features.
Sending Traces With Tags and Metadata
LangSmith now supports grouping by both tags and metadata in monitoring charts. Here's a quick refresher on how you can log traces with tags and metadata. For more information, check out our docs.
LangChain
If using LangChain, you can send a dictionary with tags and/or metadata in invoke to any Runnable. The same concept works in TypeScript as well.
chain.invoke({"input": "What is the meaning of life?"}, {"metadata": {"my_key": "My Value"}})  # sending custom metadata

chain.invoke({"input": "Hello, World!"}, {"tags": ["shared-tags"]})  # sending custom tags
LangChain Python
LangSmith SDK / API
If you're not using LangChain, you can either use the SDK or API to log traces with custom tags and/or metadata.
# Using the Python SDK
import openai
from langsmith.run_helpers import traceable

@traceable(
    run_type="llm"
    name="My LLM Call",
    tags=["tutorial"],
    metadata={"githash": "e38f04c83"},
)
def call_openai(
    messages: List[dict], model: str = "gpt-3.5-turbo", temperature: float = 0.0
) -> str:
    return openai.ChatCompletion.create(
        model=model,
        messages=messages,
        temperature=temperature,
    )
Python SDK
// Using the TypeScript SDK
import { RunTree, RunTreeConfig } from "langsmith";

const parentRunConfig: RunTreeConfig = {
    name: "My Chat Bot",
    run_type: "chain",
    inputs: {
        text: "Summarize this morning's meetings.",
    },
    extra: {
        metadata: {"githash": "e38f04c83"}
    },
    tags=["tutorial"]
};

const parentRun = new RunTree(parentRunConfig);
await parentRun.postRun();
TypeScript SDK
# Using the REST API (in Python)
requests.post(
    "https://api.smith.langchain.com/runs",
    json={
        "id": run_id,
        "name": "My Run",
        "run_type": "chain",
        "inputs": {"text": "Foo"},
        "start_time": datetime.datetime.utcnow().isoformat(),
        "session_name": project_name,
        "tags": ["langsmith", "rest", "my-example"],
        "extra": {
            "metadata": {"my_key": "My value"},
        },
    },
    headers={"x-api-key": _LANGSMITH_API_KEY},
)
REST API (in Python)
Case Study: Testing Different LLM Providers in Chat LangChain
Chat LangChain is an LLM-powered chatbot designed to answer questions about LangChain’s python documentation. We’ve deployed the chatbot to production using LangServe, and have enabled LangSmith tracing for best-in-class observability. We’ve allowed the user to pick one out of four LLM providers (Claude 2.1, Mixtral hosted on Fireworks, Google Gemini Pro, and OpenAI GPT 3.5 Turbo) to power the chat experience and are sending up the model type using the key "llm" in metadata.
Let’s say we’re interested in analyzing how each model is performing w.r.t important metrics, such as latency and time-to-first-token.
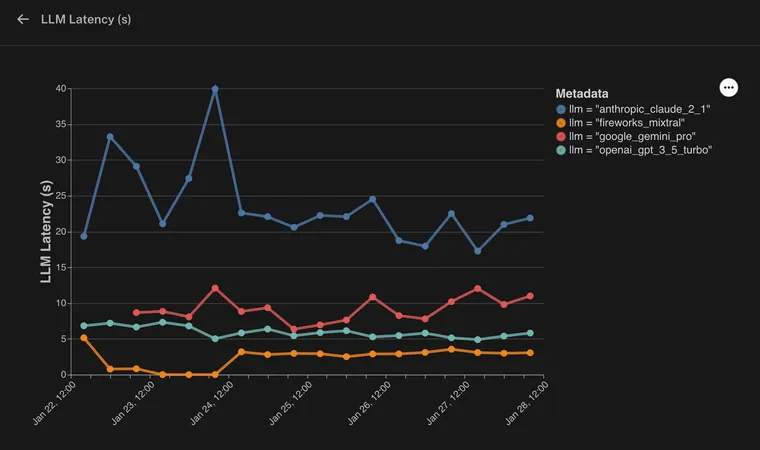
We can see here that we have grouped the monitoring charts by the llm metadata key. By analyzing the charts, we can identify any variations or discrepancies between the models and make data-driven decisions about our application.
LLM Latency
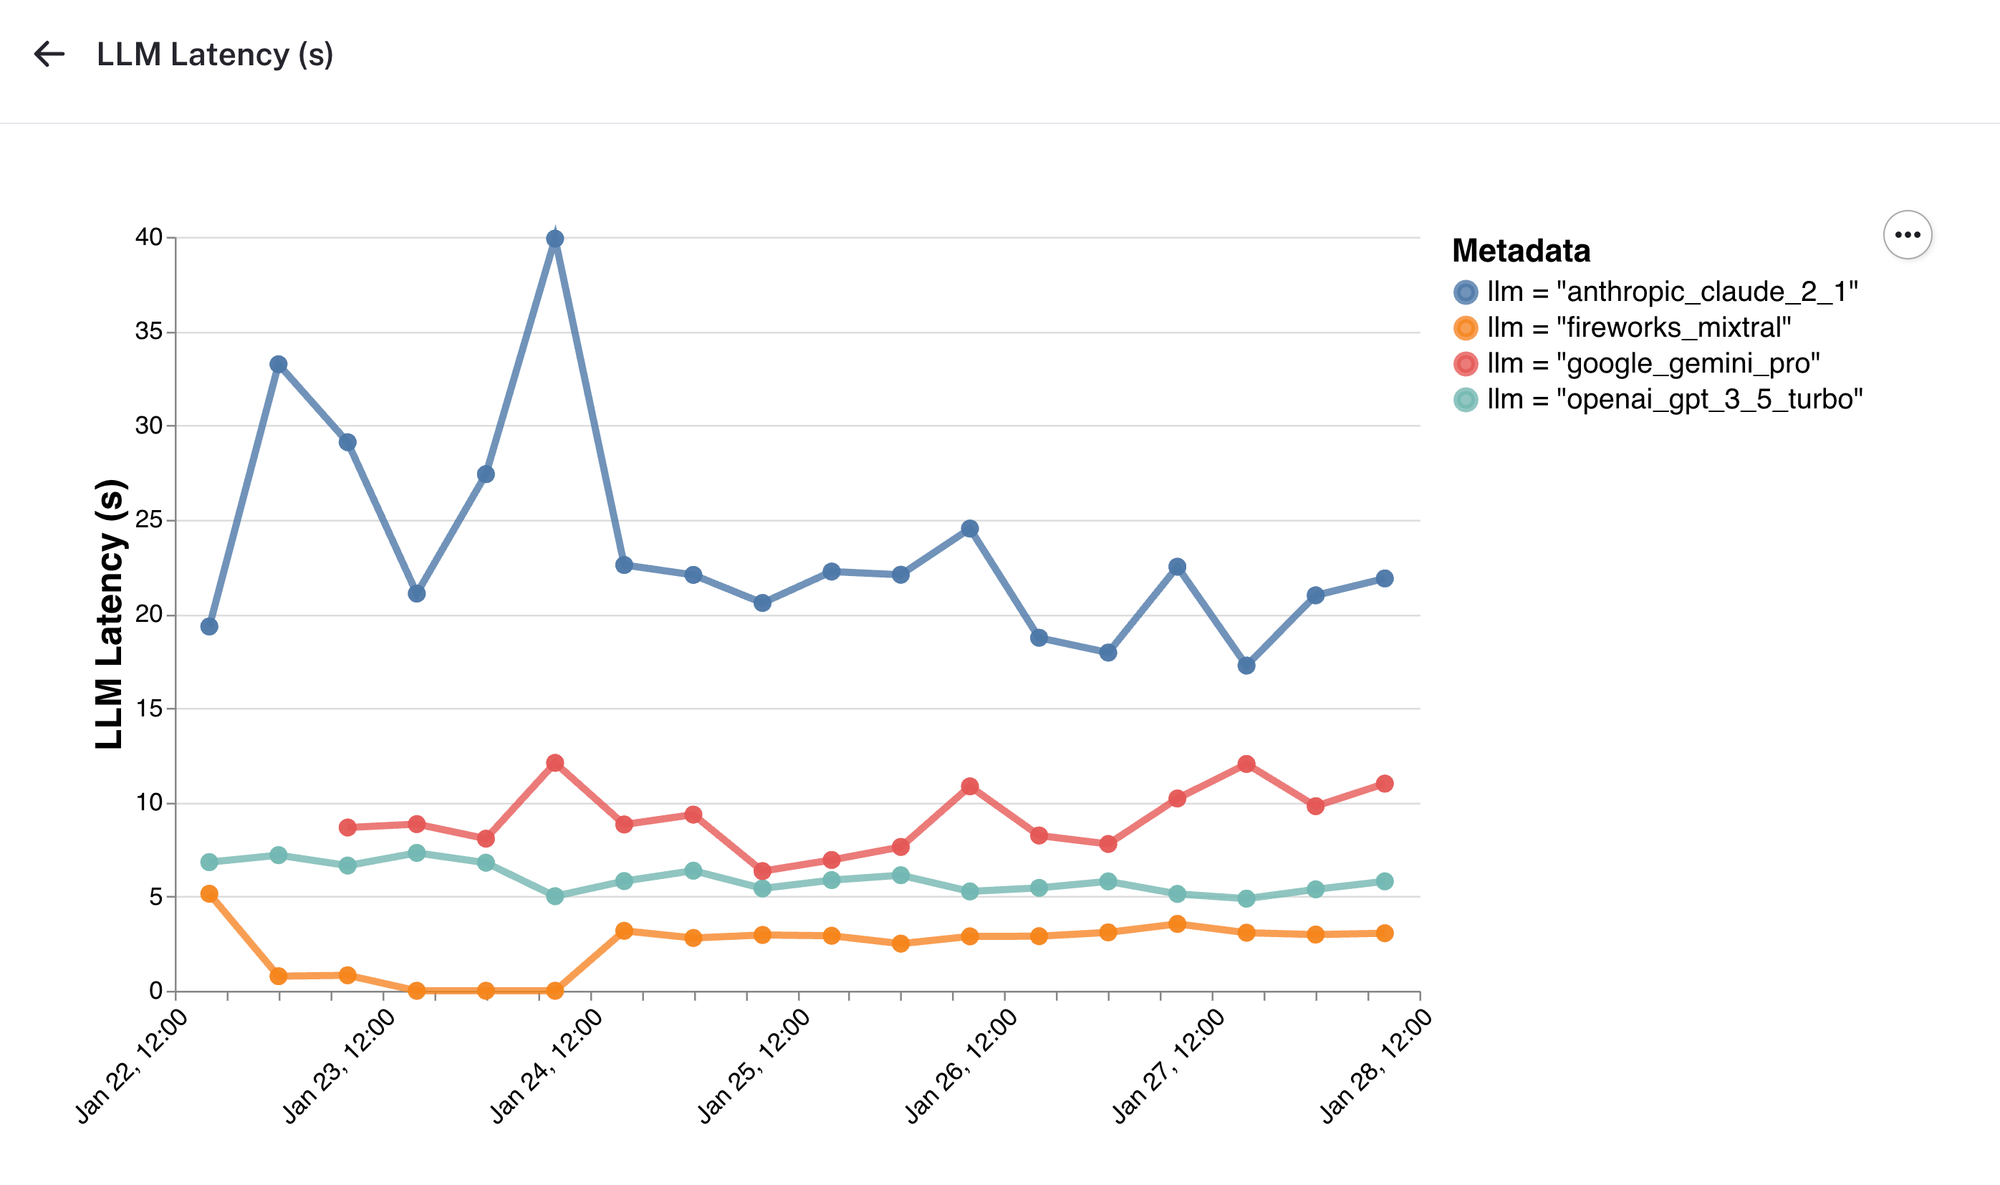
Here, we see that responses powered by Mixtral on Fireworks complete a lot faster than other providers.
Time to First Token
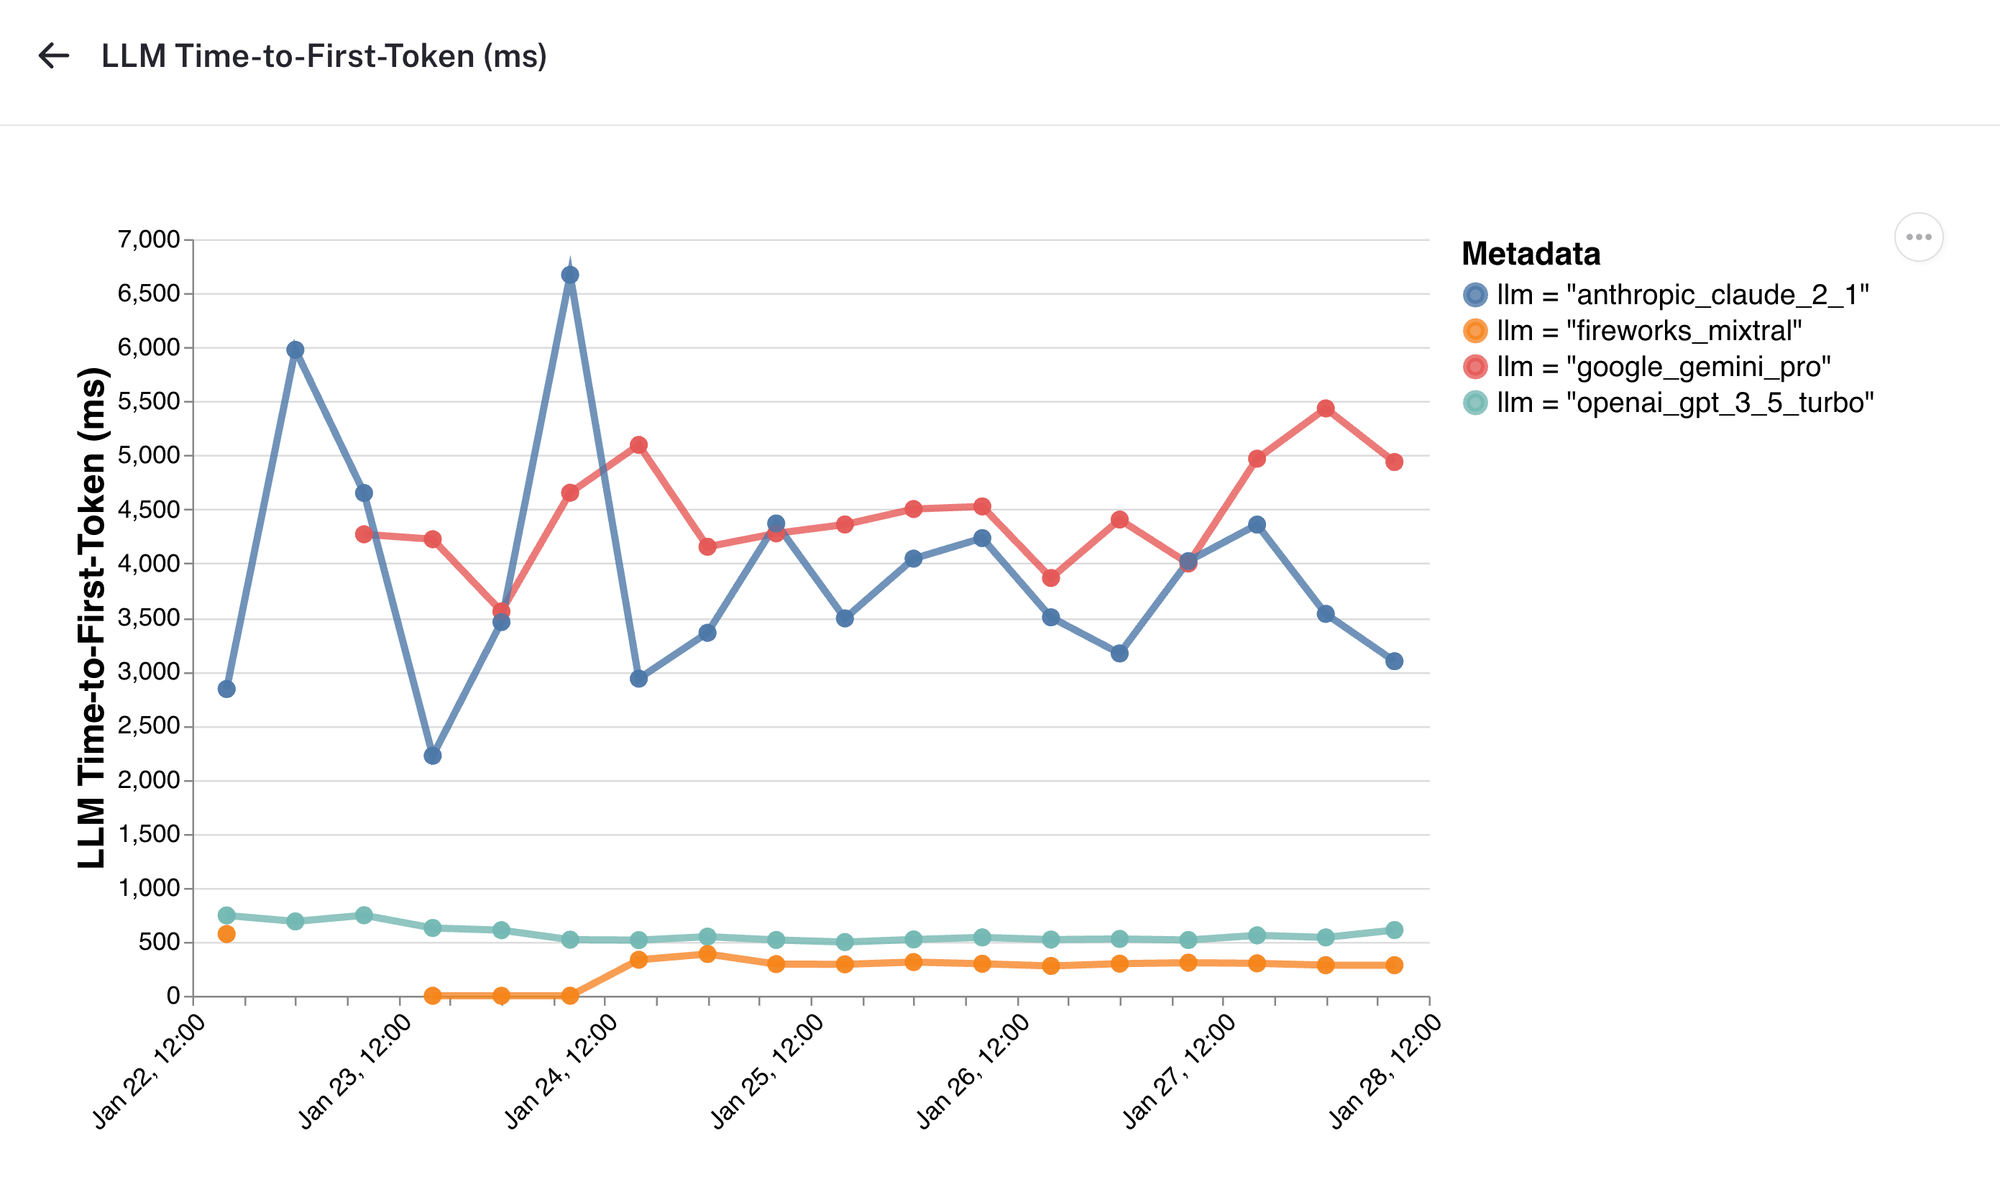
This chart shows time-to-first-token over time across the different LLM providers. Interestingly, while Google Gemini provides faster overall completion times than Claude 2.1, time-to-first-token is is trending slower.
Feedback
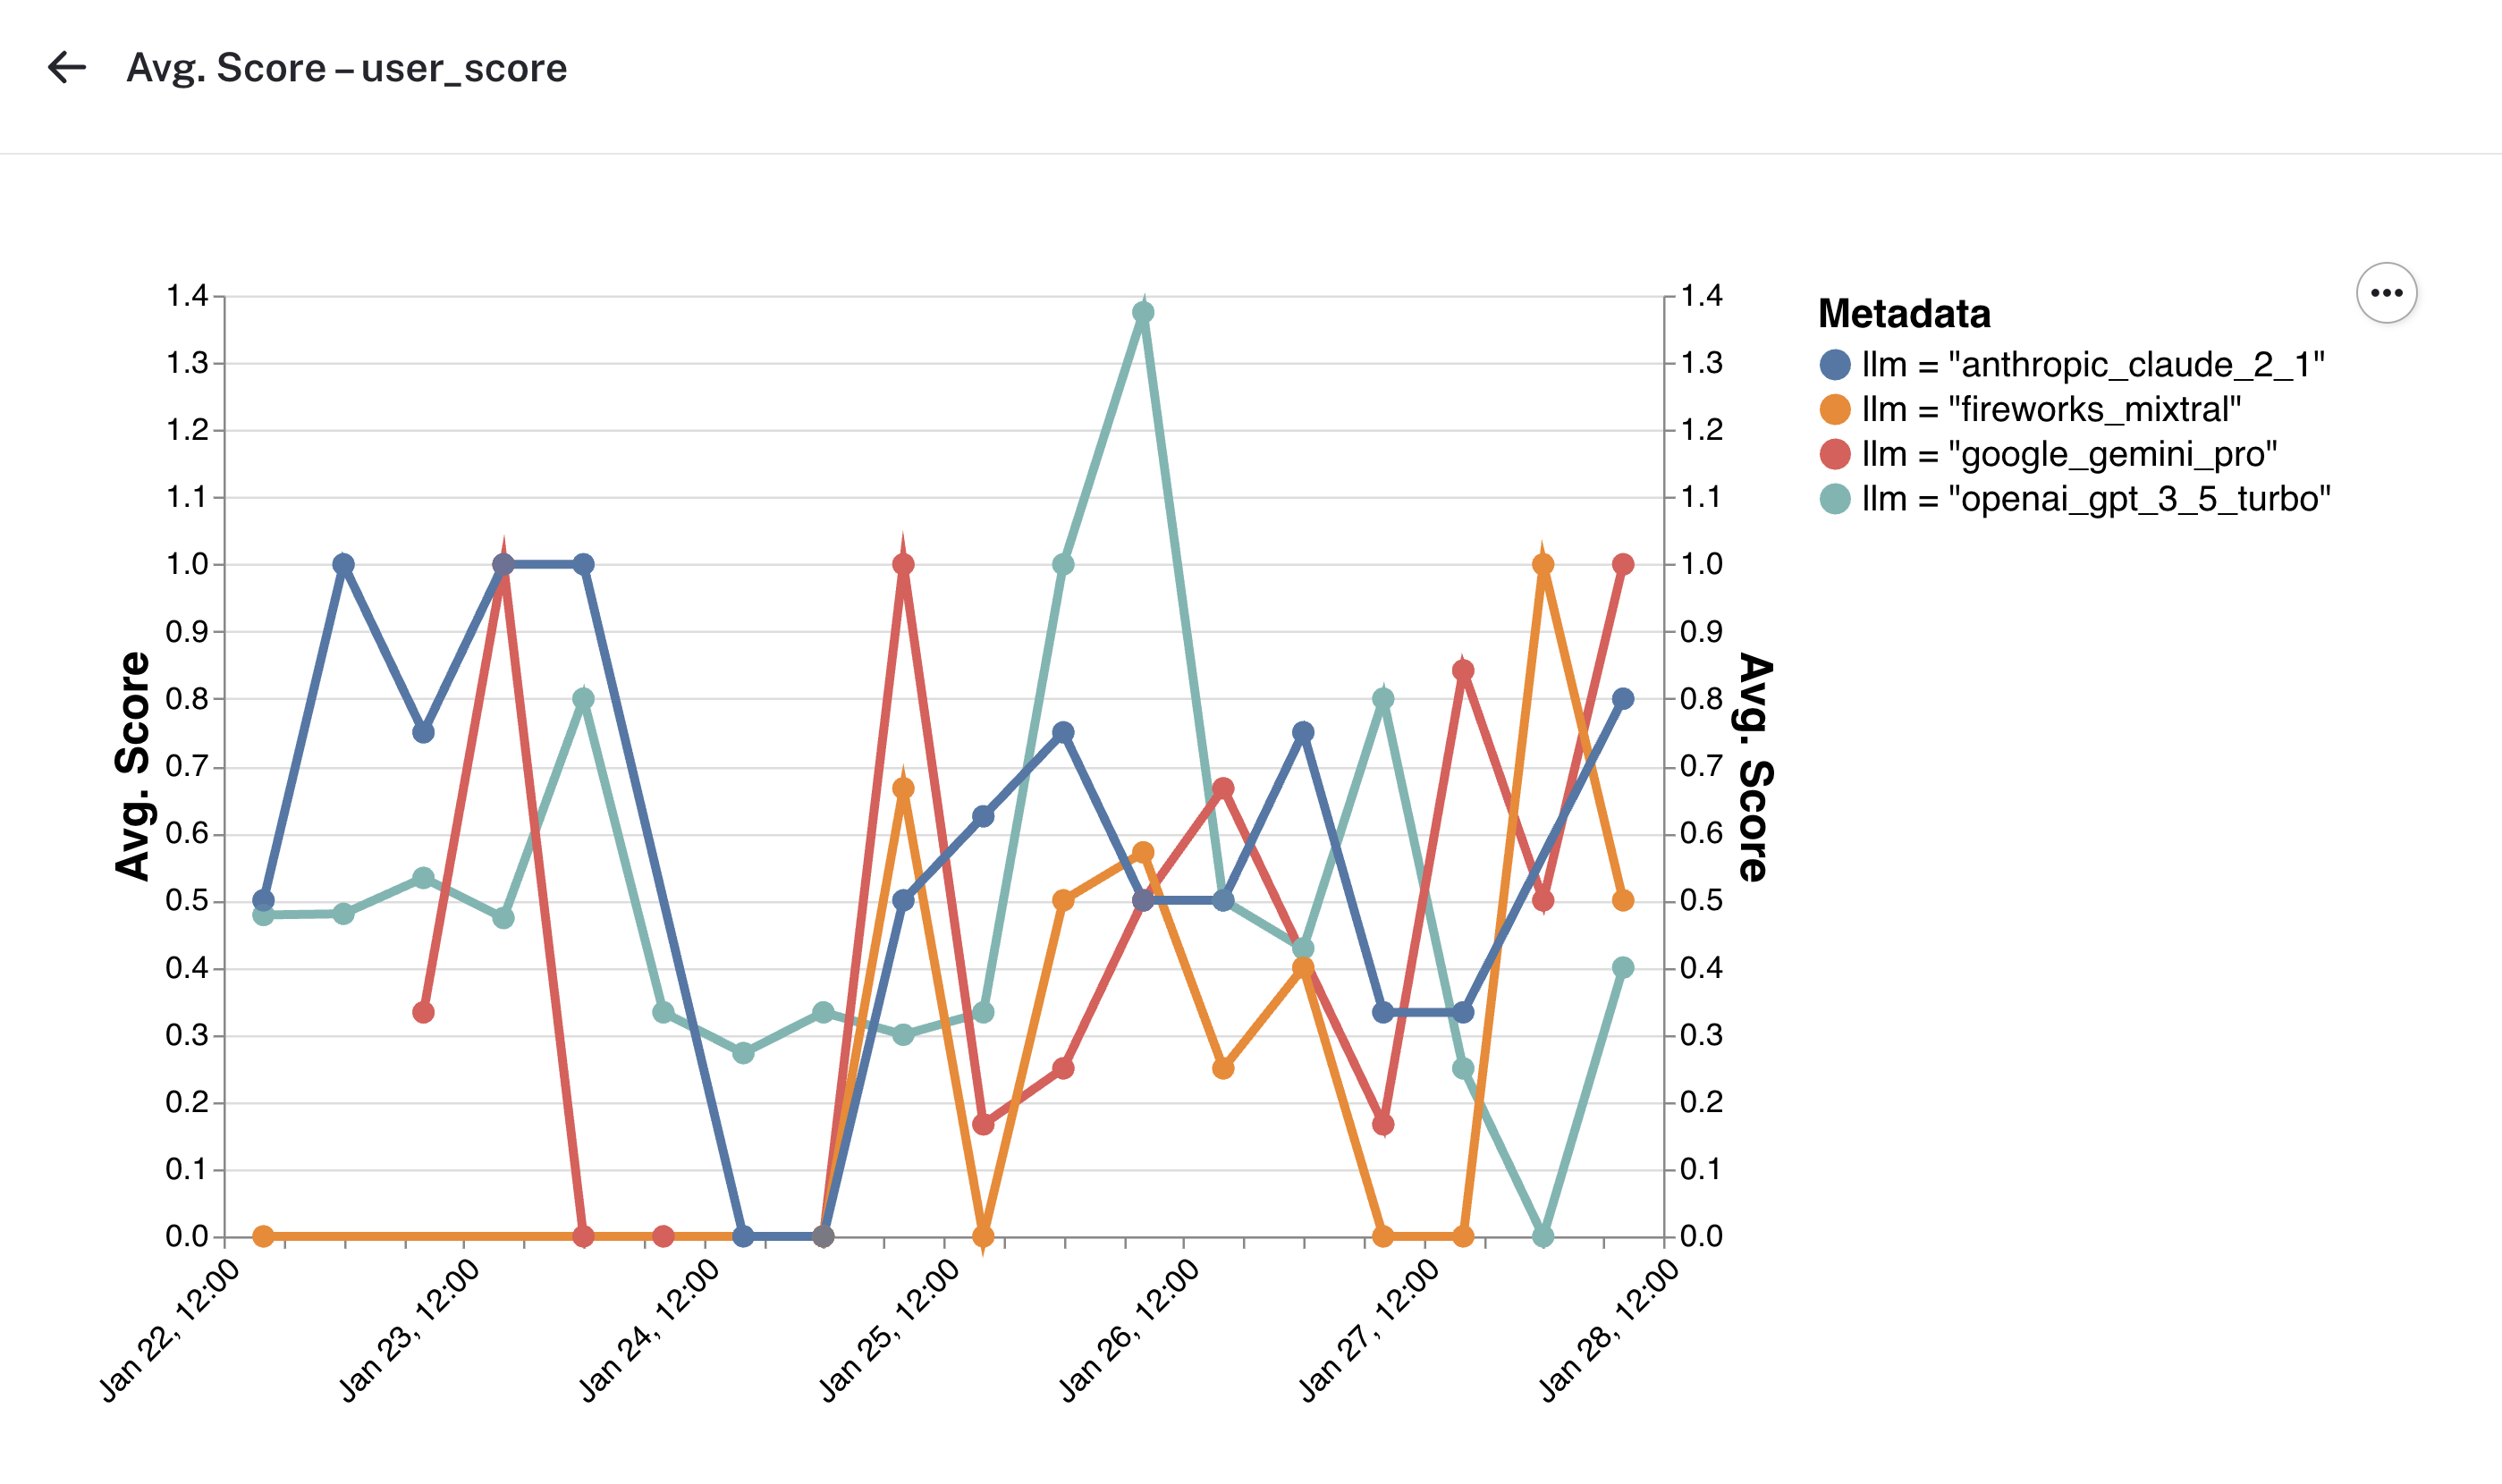
The monitoring section also shows you charts for feedback across different criteria over time. While our feedback data was noisy during this time period, you can imagine that seeing clear trends in user satisfaction in chatbot response across the different model providers would allow for assessing tradeoffs of model latency vs quality of response.
Other Use-Cases
Here, we’ve shown you can use metadata and tagging in LangSmith to group your data into different categories, one category per model-type, then analyze performance metrics for each category alongside each other. This paradigm can be easily applied to other use-cases:
- A/B Testing with Revisions: Imagine you're rolling out different feature revisions or versions in your application and want to test them side-by-side. By sending up a
revisionidentifier in the metadata and grouping by this revision in your charts, you can clearly see how each version performs with respect to each other. - Enhancing User Experience: By grouping data using
user_idorconversation_idin metadata, you gain an in-depth understanding of how different users are experiencing the application and identify any user-specific issues or trends.
These examples just scratch the surface of what's possible with LangSmith's new grouping feature.
You can sign up for LangSmith here, as well as check out the LangSmith docs and a helpful guided LangSmith walkthrough too.