Key Links:
If 2023 was a breakthrough year for LLMs, then 2024 is shaping up to be the year that a significant amount of LLM-powered applications make their way into production. From the Elastic AI Assistant to CommandBar's Copilot User Assistant - more and more complex applications are shipping to production and providing real business value. Many of these applications use LangSmith to test and debug their applications, and today we're announcing a set of new features aimed at helping applications post production-deployment.
As an AI Engineer, your job doesn't stop once an application is launched to production. Once it's in production you start getting real user data flowing through the system, allowing you to try to answer all sorts of questions. How are people using it? Where is the application messing up? Where is it performing well? How can I improve my application based on this data? How can I start to build a data flywheel?
In order to make it as easy as possible to address these questions, we're releasing a new set of features around production logging and automations. Production monitoring allows you to more easily manually explore and identify your data, while automations allow you to start acting on this data in an automated way. Like all LangSmith features, these work whether you are using LangChain or not. In the rest of this blog, we will walk through what these features are. You can also check out our YouTube Playlist for video walkthroughs.
Filtering
We've revamped our infrastructure and invested a lot in being able to support advanced filters. These advanced filters are crucial for being able to efficiently and thoroughly inspect your data. As a starting point, we support basic filtering of runs based on:
- Latency: can be used to identify runs that took an inordinate amount of time
- Errors: can be used to identify runs that hit a breaking error
- Feedback: can be used to identify runs that users identified as particularly good or bad
- Metadata/Tags: can be used to filter into subsets of runs based on their configuration
- Full Text Search: can be used to search for keywords
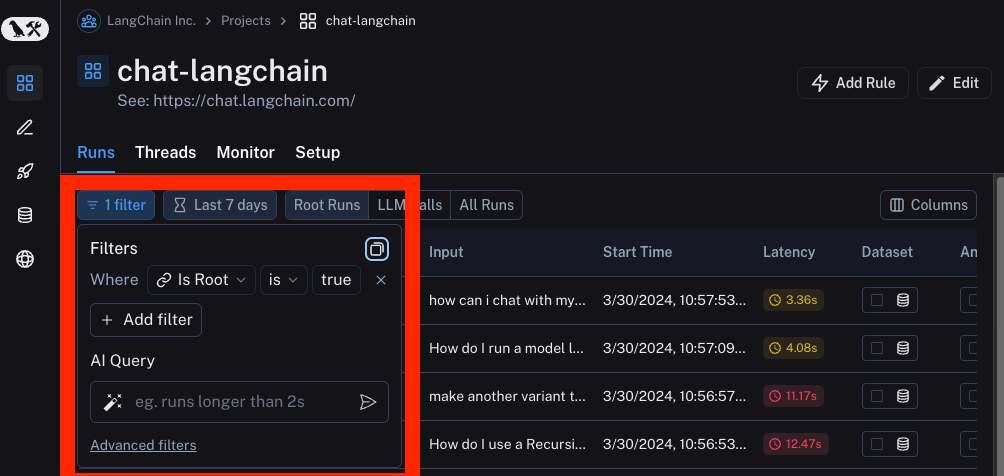
We also have added in a few more advanced forms of filtering. These include
By Trace Attributes: sometimes you may want to filter for runs based on attributes of the root run of the trace they are a part of. This is especially common when working with chains or agents, where there are multiple sub-runs that make up a larger trace. Oftentimes, you are only collecting feedback on the high level trace. You may want to look for particular types of sub-runs whose parent trace has positive or negative feedback. An example of this might be filtering for runs with name "ChatOpenAI" that in which the root run of the trace has auser_score equal to 0.
By Tree Attributes: The reverse of the above. You may want to filter for root runs of traces that have a particular type of sub-run. This can be useful in identifying high level traces that called a particular tool, for example.
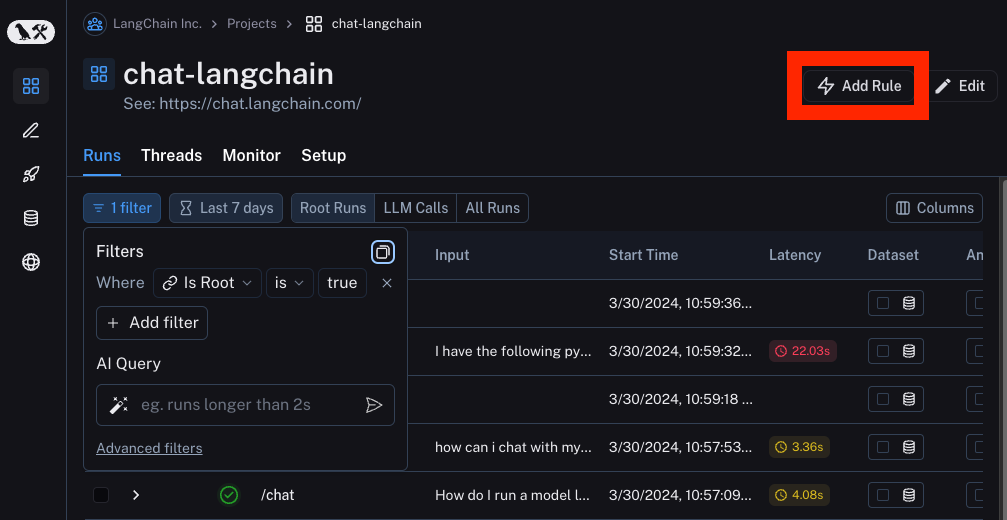
AI Query: Don't know how to construct your trace in the UI? Type in what you want to search for in natural language and we will use an LLM to convert it to our filtering language! (Yes, we monitor this with LangSmith)
Monitoring
Filtering is useful to be able to identify and look at individual datapoints. Oftentimes, you may want an even more birds eye view of what is happening. In the Monitoring tab you can view aggregate statistics over time. These statistics include LLM specific metrics like latency, time-to-first-token, cost, tokens, feedback, etc.
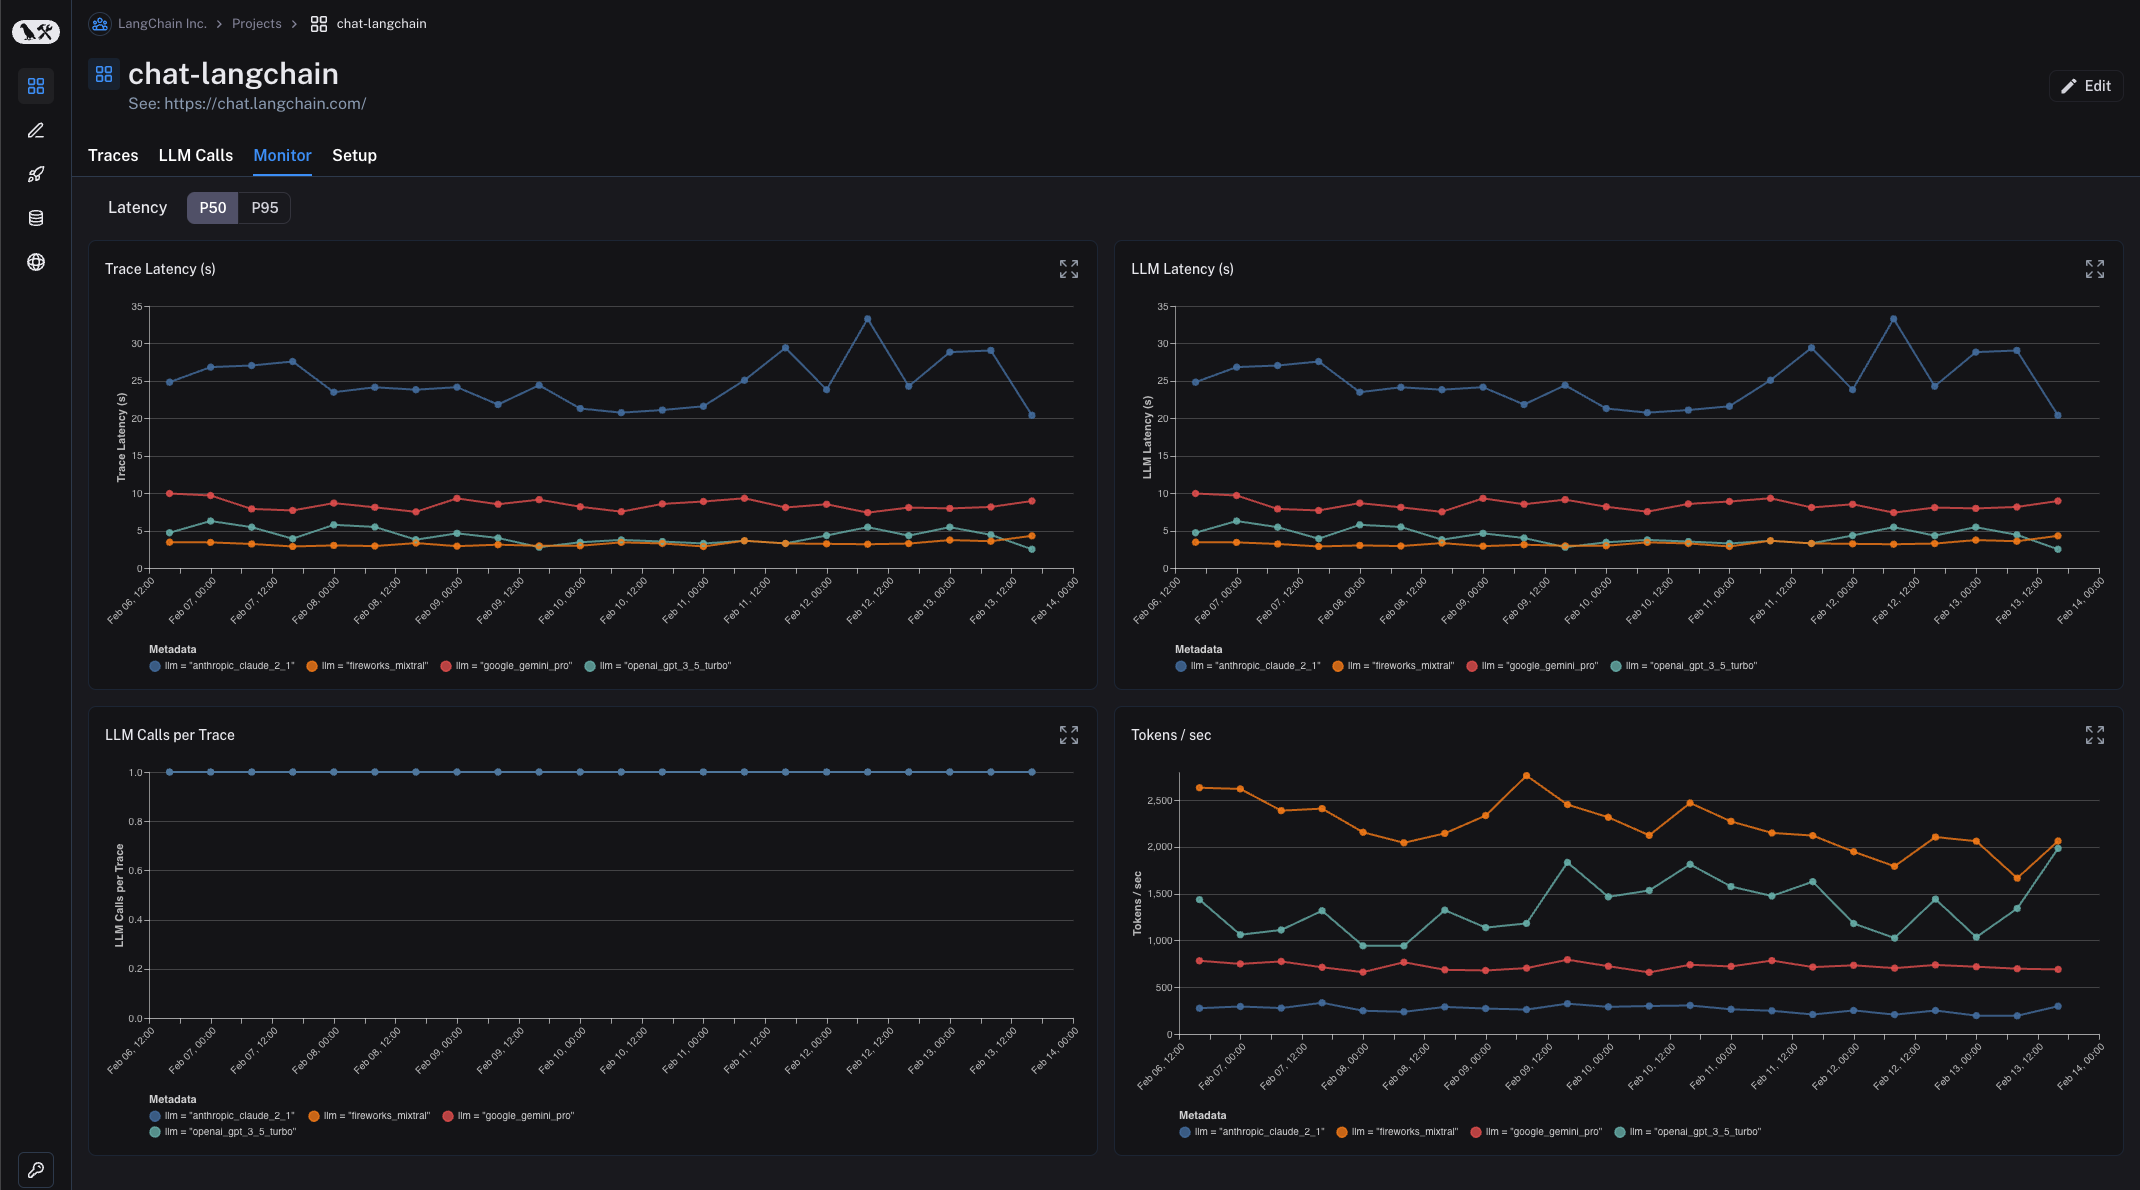
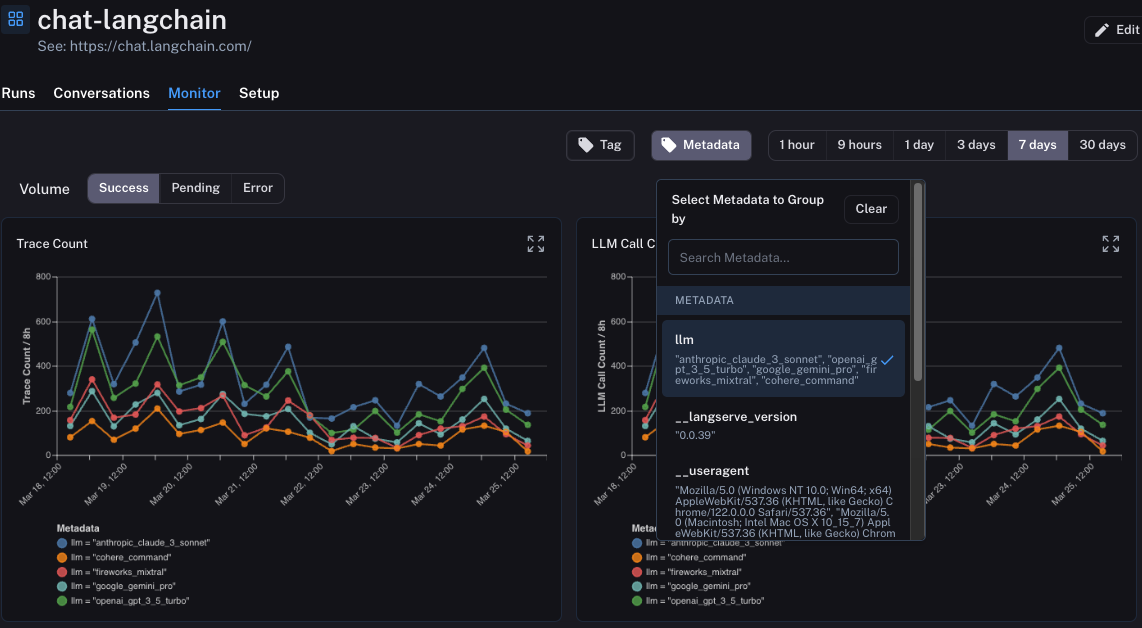
One of the more advanced features here is that you can group runs by metadata attributes. What this means is that you add a metadata tag to runs representing a particular configuration. A concrete example of this is with ChatLangChain, where we rotate between five different LLM providers. We insert as metadata a key tracking which LLM we chose. In LangSmith, you can then group the monitoring dashboards by this metadata key. This allows us to easily compare all those same stats (latency, feedback, etc) across the five different model providers.
Another incredibly useful feature of these charts is that they are all interactive. What this means is that you can click into any particular point in the chart and that will bring you to the Runs page automatically filtered to only show datapoints in the timebin you just clicked on.
Threads
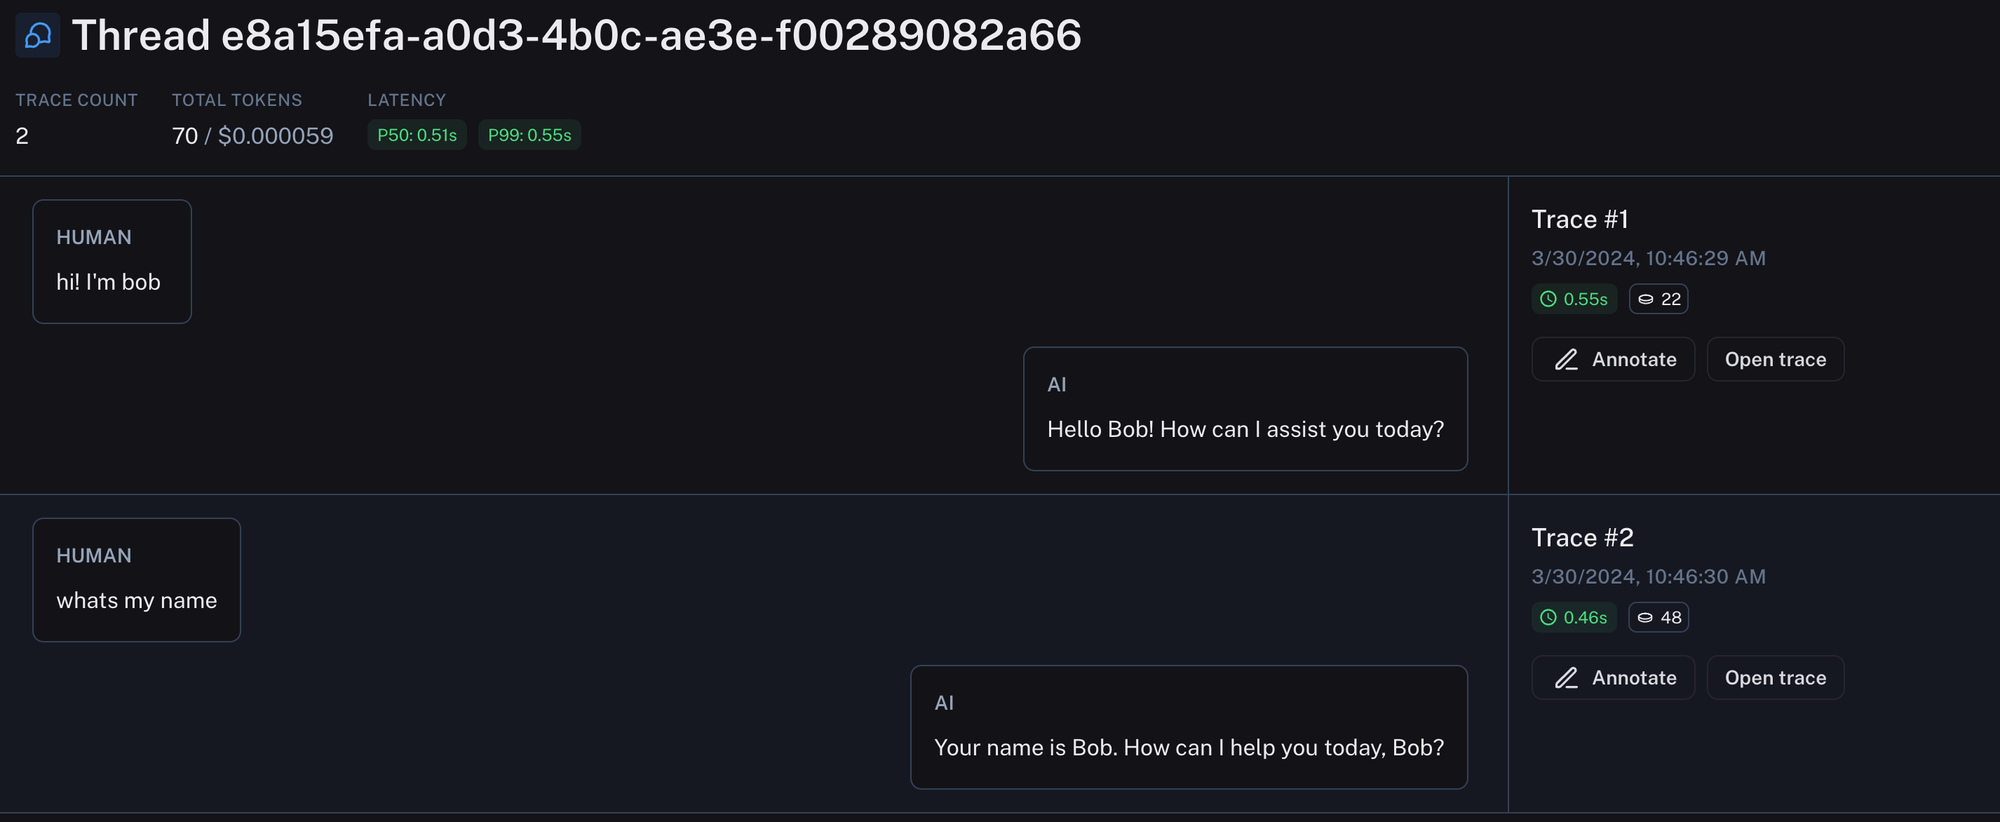
The dominant UX for LLM applications is still chat. In chat applications, there is a back and forth between human messages and an AI response. Each AI response is a trace (and can consist of many sub-runs). With Threads, we've now introduced a way to view the whole back-and-forth of a conversation in a single view. This can be done by attaching a special metadata key to each trace with the unique identifier for that conversation. This makes it much easier to debug conversations as you can see the whole thread in one place.
Automations
The previous features all make it easy to manually inspect datapoints. With Automations, you can now act upon datapoints of interest in an automated fashion.
Automations consist of three points: a filter, a sampling rate, and an action. The filter determines which subset of datapoints you want to act on. We talked about filters above, and we can reuse the same UI components to create an automation. After constructing the desired filter, you can then click on the Add Rule button to create an automation.
The sampling rate is the next thing to set. This is a rate between 0 and 1 which represents the fraction of the datapoints that meet the filter that you want want to take action on.
There are three actions you can choose from: Add to Dataset, Add to Annotation Queue, and Online Evaluation.
Add to Dataset
The Add to Dataset action does exactly what the name suggests: it automatically adds all selected runs to a dataset. The inputs of the run become the inputs of the datapoints, the outputs the outputs, and any metadata or feedback is also copied over.
This can be used to automatically construct datasets that you can use for testing, few-shot examples, or finetuning. A typical workflow here involves filtering for datapoints that received positive feedback and moving those into a dataset.
Add to Annotation Queue
The Add to Annotation Queue action is also self explanatory. It moves all selected datapoints into an annotation queue. An annotation queue is a user-friendly way to easily inspect datapoints. You can leave feedback, notes, or add to a dataset manually from this queue.
A common workflow is to send any datapoints with negative feedback into an annotation queue. This allows a reviewer to inspect all datapoints and optionally annotate them with the correct answer and move them to a dataset.
Online Evaluation
Online evaluation is a brand new feature we're adding, and one we're very excited about. While it may be tough for a human to look at a large number of datapoints - it's quite easy for a language model to do!
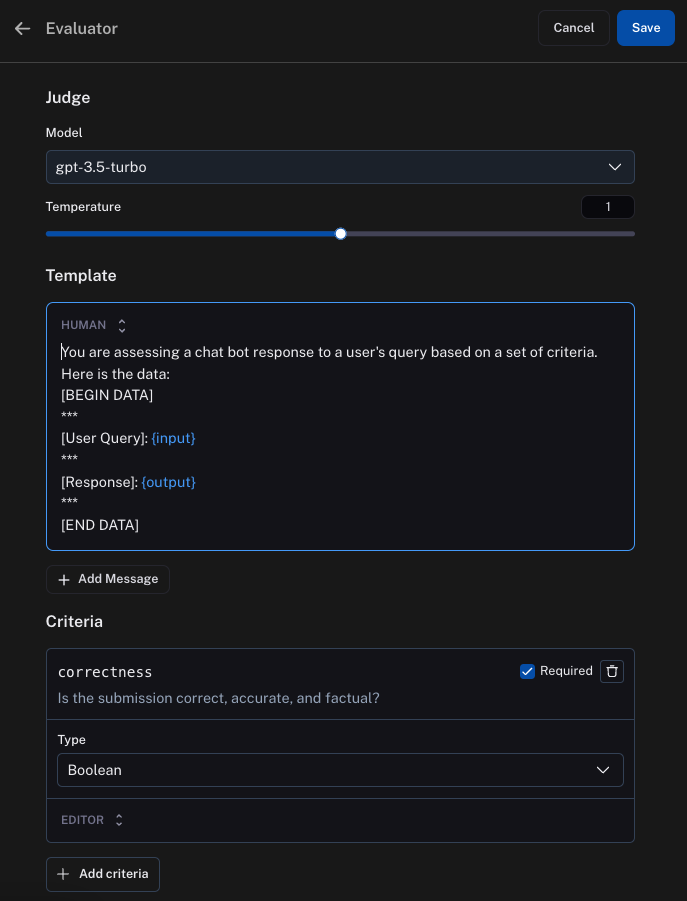
The basic idea of Online Evaluation is that each run is sent to an LLM to evaluate it according to some criteria. This criteria can be things like "rudeness" (checking if the LLM responded in a rude way) or something completely different like "topic" (classifying the user input into a variety of topics). The criteria is completely configurable.
Use Case: Optimization
We've also added an example use case showing how to combine all these features into a relatively advanced use case. The use case we put together shows how to create an app that can learn over time how to tweet in a style that you like. It does this using a few technologies:
- Log all traces to LangSmith
- Log all feedback to LangSmith, associated with the particular trace
- For all traces with positive feedback, move into a dataset
- For all traces with negative feedback, move into an annotation queue
- Use the aforementioned dataset as few-shot examples in the application
You can see a detailed walkthrough here.
Conclusion
Launching an LLM application to production is just the first step. With that, you have the gift of beginning to get real user interactions and feedback. It is crucial to capture this information and then also take advantage of it. The more easily you can do that, the more quickly your application can improve. With these "Production Logging & Automations" features, we're making it as easy as possible for you to do that.